

Sage50 Multi-Period Income Statement with Incorrect Data
(Current program: Sage 50 Canadian 2023.0, also tested 2023.3)
Greetings fellow serfs;
I’ve just discovered that if you generate a Multi-Period Income Statement in Sage 50 including a period which straddles a fiscal year end, the report will NOT include all of the data it claims to include. This problem isn’t just a hiccup that makes life difficult… this one actually gives you incorrect information.
This is related to Sage’s long-standing issues when it comes to reporting income over a year end.
Some background:
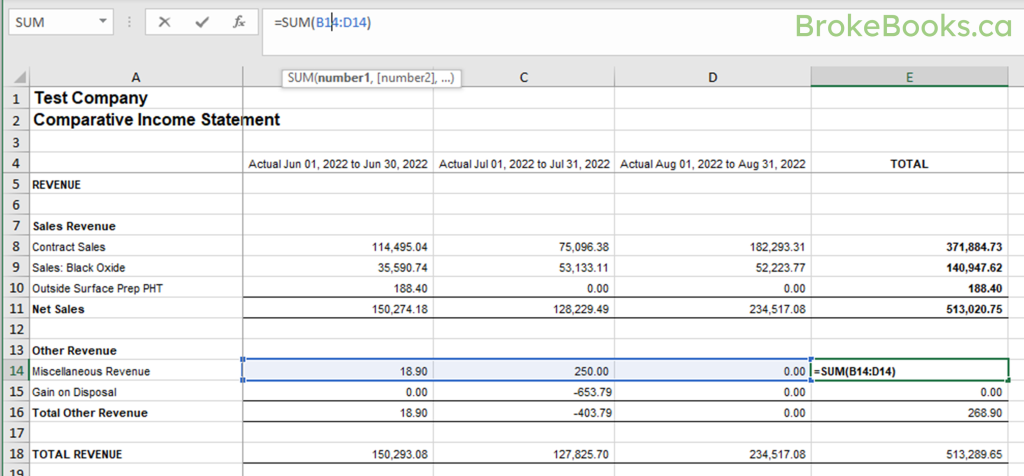
For one of my jobs I do a regular quarterly income report. I generate quarterly data using a Sage income statement, export to Excel, clean up the noise, and provide the report to management. Since one of the things I’m looking for is any anomalies or unusual expenses or income, I like to see the data by month. Usually I use a comparative income statement over the appropriate three months, but since the Sage comparative income statement is limited to either 2 or 4 periods, I generate a report for the three individual months with the fourth column being the totals (and I turn off all of the comparison columns).
The unusual thing about the particular report I require is that it does not directly align with our fiscal year end. The “quarters” for the report are based on a payroll (calendar) year, which means that every year one of the quarters straddles the fiscal year end date.
And Sage can’t cope with that.
Sage just refuses generate an income statement that straddles a fiscal year end.
For the standard Income Statement, you choose the year and any dates outside that fiscal year are just not available options.·
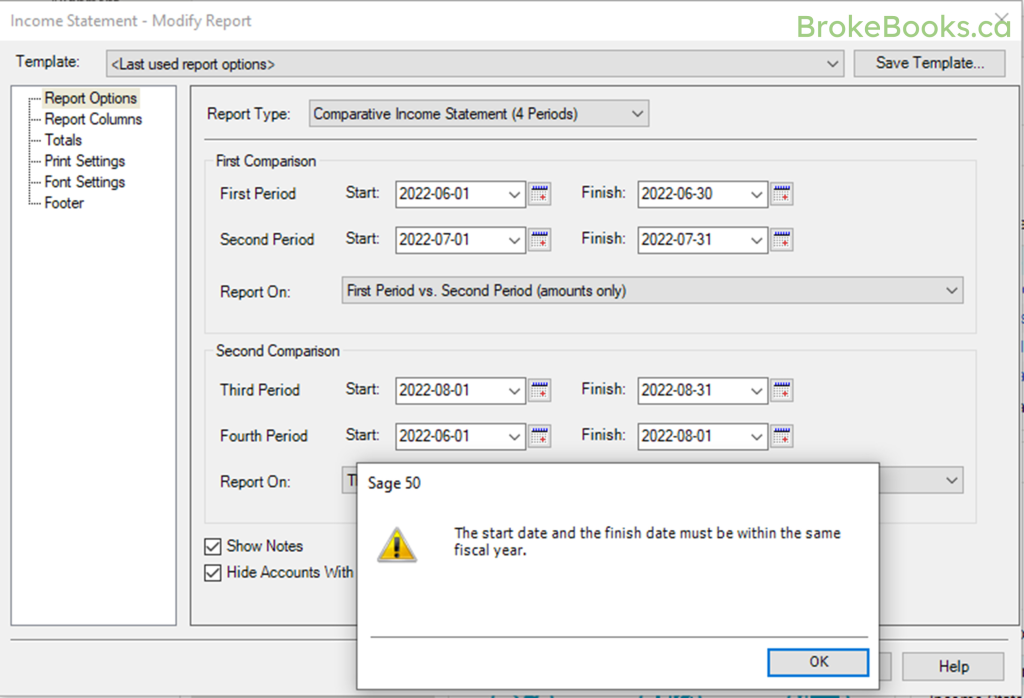
For the Comparative Income Statement, you have to just remember. It will allow you to choose whatever dates you like, but if any of the periods include a fiscal year end, you’ll see a warning that “the start date and the finish date must be within the same fiscal year” and you can’t get to the report without changing the dates. (I ended up creating an excel calculator so I can just copy and paste the dates I want. This way I don’t have to do mental gymnastics every time I want to create an income statement. )
This means that every time we cross the year end, I can’t run a total of all three months in the fourth column; I have to generate my quarterly report with a duplicate month reported in the fourth column of my Comparative Income Statement, and then manually edit it to sum the three months after I have exported to Excel.
I’ve been doing it this way for years. It’s a hassle and should not be that difficult, but it sort of works.
However…
Sage ALSO has the ability to create “Multi-Period Reports”. And this quarter I had the bright idea to try using a Multi-Period Income Statement instead of the Comparative Income Statement.
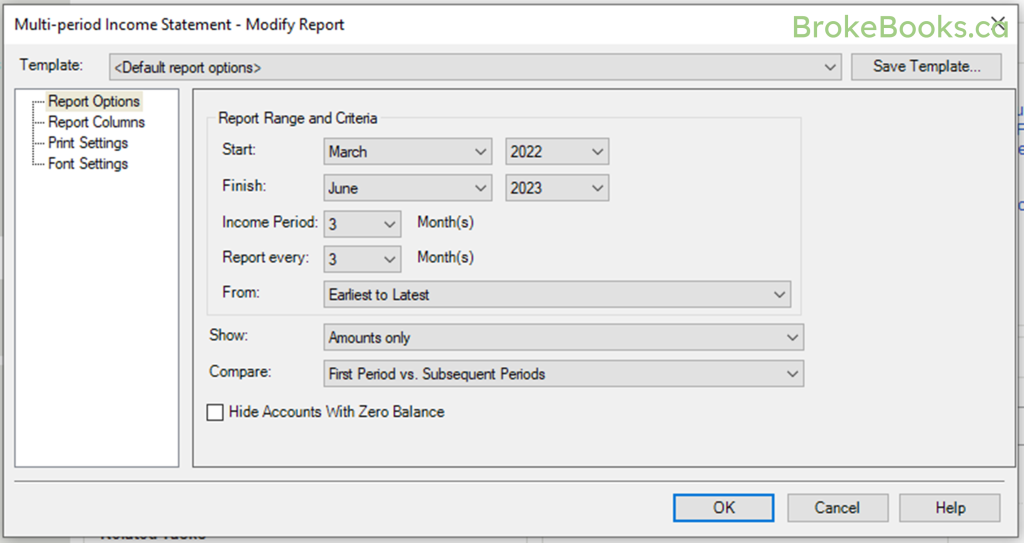
This was not a good plan. I discovered (in order of increasing bad-ness):
1. When you export to Excel, the Multi-Period Income Statement generates in two columns (a second column for the subgroup accounts) instead of one column for each period, as the Comparative Income Statement does. This makes it more difficult to manipulate the data in Excel… I ended up manually copying and pasting all the little subgroup account totals into the same column as the rest of the data, and then manually redoing all the formulae to make sure it still worked. The standard Income Statement has the same issue, and I often use the Comparative Income Statement even if I only need one period’s data for exactly this reason.
2. You can’t click on account line to see what is in the account. Normally I use multi-period-type reports to find anomalies in the data. For example, if I see a particularly large telephone expense compared to other periods, I want to be able to click through to the ledger report to see the individual entries which are posted to that account. This allows me to find and correct errors, identify expense types that are increasing unexpectedly, etc. I can click through on the standard Income Statement and on the Comparative Income Statement, but I can’t do on the Multi-Period Income Statement. This meant I had to manually generate a LOT of extra reports.
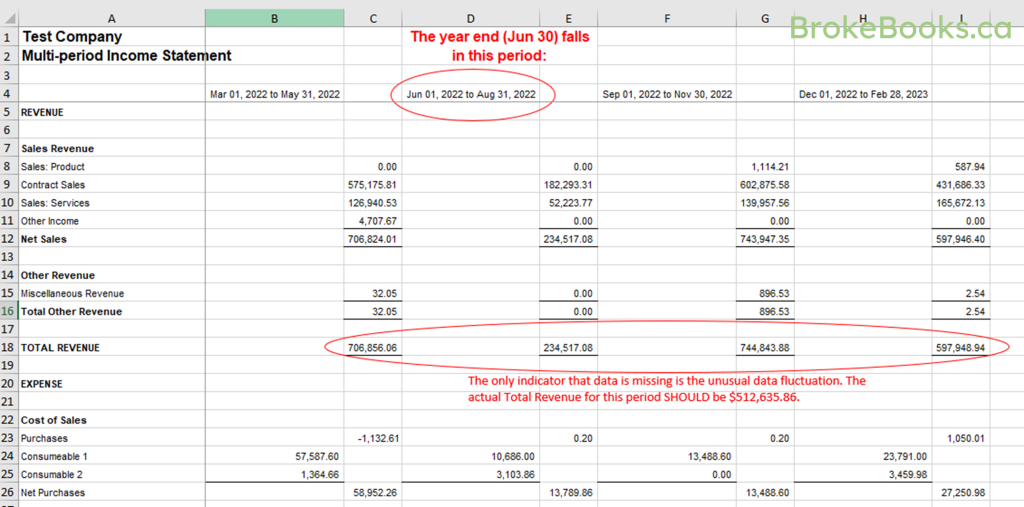
3. The most significant problem: When I generated a report over 6 quarters, where one of the periods straddled a year end, it allowed me to generate the report, but it produced INCORRECT DATA. At first, when it allowed me to generate the report without any warnings, I was excited… I thought maybe I’d finally found a way to be able to create income statements over a year end! And then as I was analyzing the data, I started to wonder why the expenses were so much lower than average in this one period. Because I couldn’t click through easily, it took me a bit of work before I finally realized… the period straddling the fiscal year end only included the amounts entered on ONE side of the fiscal year end (I haven’t yet figured out how it decides which ones to pick), and did not include the amounts entered on the other side. In my report, that meant only one month’s worth of data was included, when it should have included three. The report headers claimed that column should contain three month’s worth of data… but the actual numbers only included one month’s worth of data.
You can do better than this, Sage.

Thanks for reading BrokeBooks!
Head over to Substack to comment: brokebooks.substack.com/subscribe
Join the group on Reddit: r/BrokeBooks/
Follow me on Twitter: twitter.com/AccruedValue